
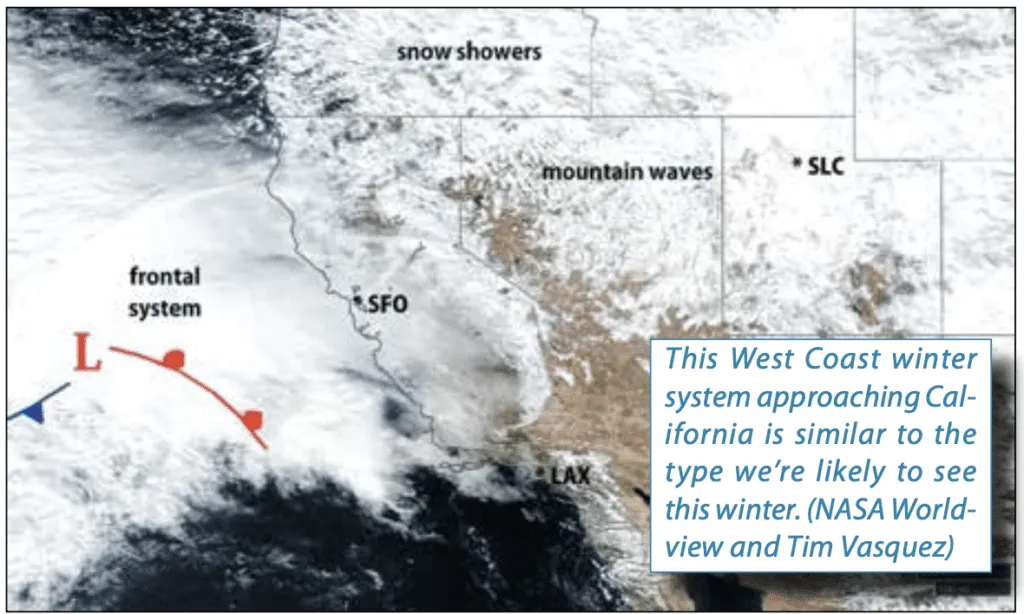
You’ve probably heard at least something about a strong El Niño episode that’s underway. During such years, weather hazards are plentiful, especially in the western and southeastern states. While there’s no way to predict the details, we’ll at least give you a sort of tool kit for working with conditions this winter.
Winter marks a flip flop in the distribution of heat across the Northern Hemisphere. Ocean waters are relatively cool during the summer compared to land, but during the winter the ocean becomes a vast reservoir of heat and moisture. You’ve probably heard the terms “atmospheric river” and “Pineapple Express” on various weather forecasts. We’ll be hearing a lot about that over the coming weeks, and we’ll touch on those terms here.
The Patterns Change
For meteorologists, one of the big indicators that marks wintertime is the enormous increase in wind speed and atmospheric momentum in the North Hemisphere. At the jet stream level, winds across the United States during July average about 20-40 knots, but in January these speeds rise to 60-80 knots and often much higher. This significantly increases the energy available to weather systems.
There’s a southward shift in the jet stream as well. July finds the jet stream across the Gulf of Alaska, Canada, and the Canadian Maritimes. By January, however, the jet stream is fully rooted in the United States and the adjoining oceanic areas. This brings a smorgasbord of weather systems during the cold season, ranging from weak, transitory upper-level disturbances to well-developed frontal systems.
Winter also brings greater temperature differences between the lower and upper troposphere. We might think of summer as having the heat and the instability, but for stability, it’s the contrast that is important, not the heat itself. The more the atmosphere leans vertically toward “cold over warm,” the higher the static instability.
In such an environment, lapse rates are steeper, and that means much greater potential for not only severe weather but also mechanical turbulence. Some of the greatest potential for turbulence is where fresh cold air masses roll out across terrain being strongly warmed by the sun. Wind shear can also develop with a strong enough wind direction differential.
Clear air turbulence (CAT) and mountain waves also deserve attention. For these phenomena, forecasters look for large wind components perpendicular to mountain ranges. Strong westerly flow across the Rockies is a particularly effective source of CAT and mountain waves. What differentiates a weak CAT from a strong CAT environment boils down to the vertical shear, the instability, and the type of air mass overlying the mountain range itself.
To say that there are good, useful rules of thumb for CAT would be an oversimplification. In fact from the 1940s to the 1990s, CAT and mountain wave events were a particularly vexing problem for airline weather forecasters and led to elaborate and sometimes very technical approaches. Close monitoring of pilot reports (PIREPs) was crucial for accurate turbulence forecasting.
Fortunately mesoscale models have come to the rescue during the past twenty years. The best thing you can do is monitor SIGMETs and AIRMETs and use the excellent turbulence products at the Aviation Weather Center homepage, in particular the Graphical Turbulence Guidance (GTG) product. The GTG data uses numerical modeling to directly identify those areas where turbulence is likely.
Thunderstorms
It might seem strange to think of thunderstorms being a concern in winter. This reasoning might be justified in the Great Lakes and Northwest regions. However the cooler months, due to the fact that winds aloft are stronger, are notorious for increasing storm organization. By this we mean storms that form structures conducive to life cycles with large time scales. This often means upscale growth in terms of length and width. Needless to say, such storms have a major impact on flight operations.
One of the best ways to get storm organization is with lots of vertical shear of the wind field. Strong boundaries, such as those we see with well-developed cold fronts and warm fronts, also enhance storm organization.
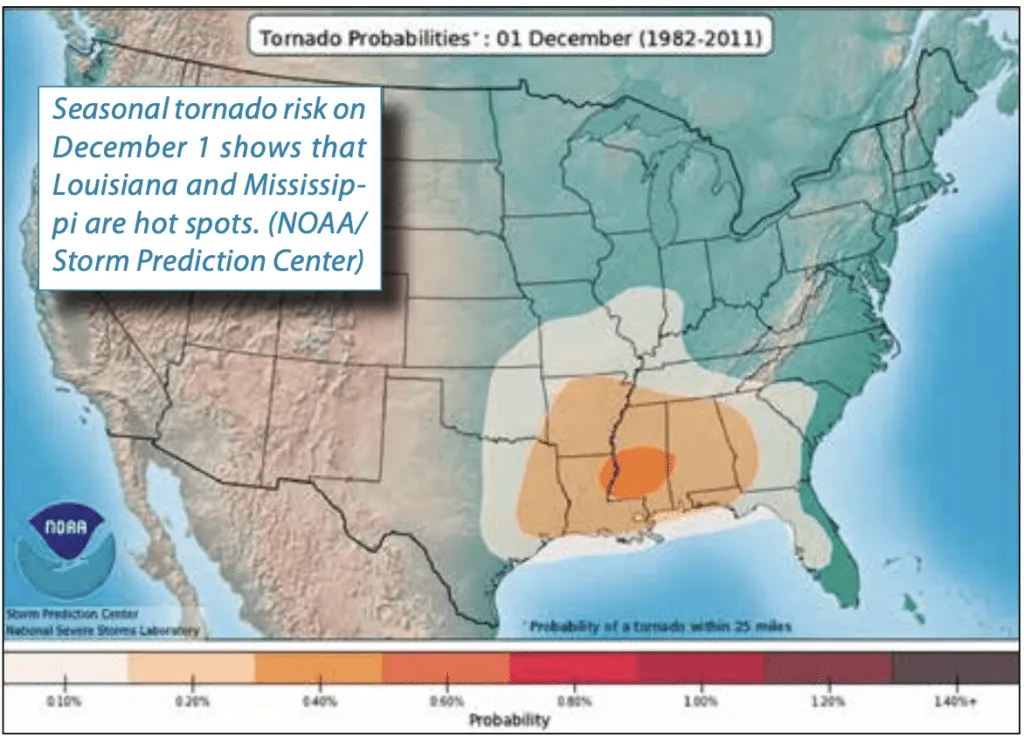
Although we usually associate spring with tornado season, it’s actually winter when the southeast United States sees most of its significant severe weather. From November to February a corridor of enhanced potential for severe weather is focused on a line from Houston to Atlanta, and extends some distance south into Florida and north into Arkansas and Tennessee.
Major tornado outbreaks and severe weather episodes have taken place in the Southeast during the winter. Our readers in Dallas may well remember the Garland-Rowlett tornado the day after Christmas 2015, which killed 10 and produced $27 million in damage. This same area had been wrecked by a similar tornado on December 13, 1984. And there are even winter tornadoes for the record books: The longest tracked tornado in modern history touched down on December 10, 2021. Over a period of three hours this twister moved 166 miles, was rated at EF4 on the Enhanced Fujita Scale, and destroyed the town of Mayfield, Kentucky.
Icing
Winter is certainly the ideal time to study up on icing hazards. From a forecasting standpoint, the most problematic areas are where warm air flows from the south or east into well-developed weather systems. This is usually in an “overrunning” area at heights of 5000 to 10,000 feet MSL and may be described as a “warm tongue” or “moist tongue” aloft. In more technical terms, this is a “warm conveyor belt.” The temperature of course is critical, and temperatures of 0 to -5 degrees C are especially suited to for producing the dreaded clear ice.AAll of these ingredients come together near warm fronts and occluded fronts, so in those areas you should be especially careful. However certain types of cold fronts, in particular the “anafront,” are also capable of producing severe icing layers as they have structural similarities to warm fronts. Such anafronts are quite common in the western United States but may occasionally be found in the East.
That said, a front is not necessarily needed, as significant icing simply requires precipitation or supercooled drops in the range of 0 to -20 degrees C. However frontal systems with their enhanced lift and advection are capable of producing the vast numbers of drops needed to accrete on airframe surfaces, so it can be useful to examine the weather charts and be aware of the weather regimes where you’ll be flying.
Atmospheric Rivers
One of the hot topics in meteorology right now is the study of atmospheric rivers (ARs). A well-developed atmospheric river can carry several times the volume of water of the Amazon River in a given unit of time. This represents a firehose of moisture that is directed at the United States from time to time, especially between November and March. Where an AR is crossing your flight route or destination airport, you can expect significant IMC, icing potential, and extensive precipitation areas extending from the surface up to FL200-250 or higher.
If you go to your favorite search engine and enter UCSD Center for Western Weather and Water Extremes and click on Forecasts, you can find weather charts showing atmospheric river activity. My favorite chart is IVT (Integrated Vapor Transport) as this lays out exactly where the AR is. In short if the IVT is above 300-500, expect significant impacts to flight operations.
However I would recommend not focusing only on the values, but also on the patterns themselves. Watch the AR plumes from day to day as they lift in the United States from the tropics. When you see an AR with high IVT values bearing down on your area you can count on weather impacts and possibly a period with significant weather problems. When the AR shifts out of your area, you can expect rapidly improving conditions.
Fog
Low visibilities are a major hazard during the winter months, and you’re probably well familiar with how airfields can rapidly drop below minimums. As a general rule, radiation fog can be expected when skies are clear and the ground is wet from recent rainfall or slushy snowfall. Winds of three to seven knots are especially favorable for fog development, as calm winds favor the moisture settling out as dew.
Advection fog is common across the Southern and Eastern states when rich tropical moisture returns over chilly land surfaces following a period of cold weather. As you might guess, this kind of fog precedes a warm front, which might be lifting northward from the coastal Gulf of Mexico or the Eastern Seaboard. Unlike radiation fog, which is not associated with low ceilings until it breaks up, advection fog can co-exist with low layers of stratus and low ceilings.
Alberta Clippers
If you’ve not flown much in the Midwest, it’s a good idea to familiarize yourself with the fast-moving Alberta Clipper. This represents a reinforcing shot of cold air that moves southeast out of the Canadian Prairies, often taking a track into Illinois or Michigan before moving east into the Appalachian region. The cold air combines with the warm air in advance of the system and produces a small frontal low or “baroclinic low,” which in turn is supported by an upper-level disturbance and enhanced jet stream winds.
The worst weather with the Alberta Clipper is found close to, and just north of, the track of the surface low. In this area, rain showers or snow showers might occur that last several hours, along with icing hazards. South of the low, narrow bands of showers are concentrated along the cold front. Strong gusty northwest winds occur in the wake of the cold front, with conditions rapidly improving to VMC. The strong cold advection produces layers of mechanical turbulence, often up to 5000 feet or more, with a strong diurnal character. Mountain wave activity and clear air turbulence often develop as the cold front crosses the Appalachians.
If significant moisture exists in the Southeast states, with IMC on weather charts in Tennessee and in bordering states, be on guard for weather problems. The Alberta clipper may entrain this moisture and develop into a large frontal system as it moves through the Ohio River Valley and Appalachians. This can increase the risk of severe weather along and ahead of the cold front, and sometimes along the warm front as well.
Precipitation
Finally if you’re mostly a weekend or good-weather flyer, I would urge you to take time to review all the different winter precipitation types you might find on METAR reports and understand what they mean.
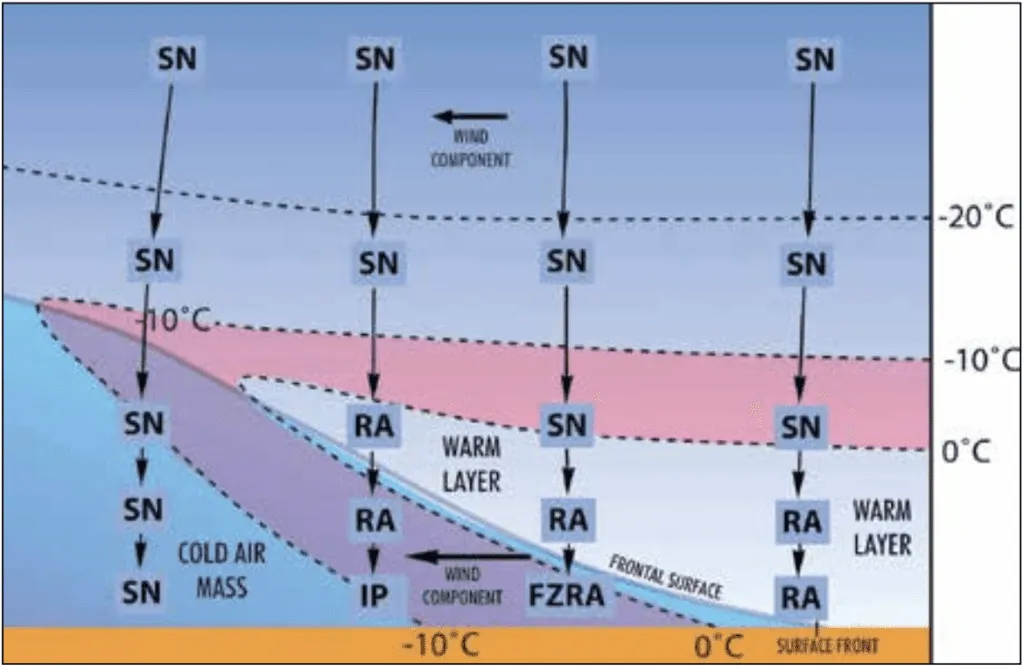
For example, rain simply reaches the ground in liquid form and implies that plenty of warm air exists near the ground. On the other hand, snow is a solid precipitation form, representing an aggregation of ice crystals, and it implies that the column is subfreezing from the surface throughout the troposphere. Most snow develops in the dendritic growth zone (DGZ) of -10 to -20 degrees C. As pure snow does not involve large drops of supercooled water, light to moderate snow is normally associated with light rime icing.
Mixed-phase precipitation is associated with some of the worst flying weather. Ice pellets (IP), also called sleet, implies that rain from a warmer layer aloft has fallen through a cold layer and frozen. This suggests a “warm tongue” or “warm conveyor belt” exists aloft, and of course we explained the significance of this up above. Freezing rain (FZRA) is rain that has frozen on impact at the surface. This is associated with the same sort of weather setup as ice pellets. Both of these precipitation forms are closely related and are associated with severe clear icing.
In general, ice pellets are found north of bands of freezing rain. This is due to the deeper cold air that is found as one travels north. Travel far enough north and this sleet gives way to snow. South of the band of freezing rain, the precipitation transitions to warm rain. This is due to the cold layer thinning out and warming to above freezing.
However this doesn’t rule out possible cold air aloft. The rain could very well be snow that has melted as it fell through warmer air. So there can still be some degree of icing going on.
Obviously this can all get quite complicated. Don’t worry too much about the details. The important thing is to get a good weather briefing and take a few minutes where you can to review the weather patterns at hand. With the information we’ve just covered, you’ll hopefully have a few ace cards to play if the forecast changes unexpectedly.
Tim Vasquez forecasted for C-5B pilots operating out of Kenya, B-1B pilots based at Dyess AFB, E-6 TACAMO jets operating out of Texas, and even Army UH-60 missions near the DMZ. His first assignment was weather specialist for the F-117A program in Nevada. Through WX SMARTS he hopes to provide his forecast services to you as well.


