Meteorologists Andrew Fultz and Walker Ashley in 2016 undertook a comprehensive review of NTSB data and published their findings in Physical Geography. The researchers looked at almost 60,000 general aviation accidents between 1982 and 2013. They identified 25 percent of the accidents as weather-related. Out of those accidents, 26 percent were fatal. One sobering finding was that 35 percent of all fatal GA accidents are due to weather.
The 31-year period saw 3972 accidents and 8052 lives lost in GA weather accidents. In 1982 things were grim, with an average of three crashes and two fatalities per day from weather. Through efforts of flight instructors, meteorologists, the FAA, and the NTSB, we’ve seen a fourfold drop in these numbers, but still with over 200 weather accidents each year, there’s much work to be done.
What’s the Cause?
A closer study found that low ceilings, fog, precipitation, and weather below minimums (but not icing) contributed to 69 percent of all fatal weather-related accidents. This points to VFR flight into IMC, lack of IFR training, poor situational awareness, and the need to properly use available weather information.
Wind contributed to only 17 percent of the fatal accidents, but it was the leading cause of all weather-related accidents. This is probably from wind-induced runway accidents that are seldom fatal. Icing, carb ice, and density altitude contributed another 18 percent of fatal accidents. (Note that the percentages don’t add up to 100 percent since multiple causes can be ascribed to a crash.)
While convective weather, microbursts, and turbulence made up less than 10 percent of weather accidents, up to 65 percent of these accidents were fatal. The takeaway is that GA pilots exercise caution around dangerous weather, but enormous risks hide in more benign weather. An uptick in wind-related accidents over the years should serve as warning for all pilots when significant winds are forecast.
The Weather Briefing
Of course, where it all comes together is the preflight weather briefing. In terms of safety, this not only supplies you with knowledge about the current weather situation, but gives you a solid basis on which to exercise your experience, and provides a conceptual model for understanding what’s happening so that your awareness of the situation has context.
How you approach the briefing is actually just as important as the information. Many pilots get stuck in a go/no-go mentality, which only provides a superficial look at things. The correct technique is to take in all the information, build a full mental picture of what’s happening along your route, and from there, decide how it will impact your flight.
Ceilings
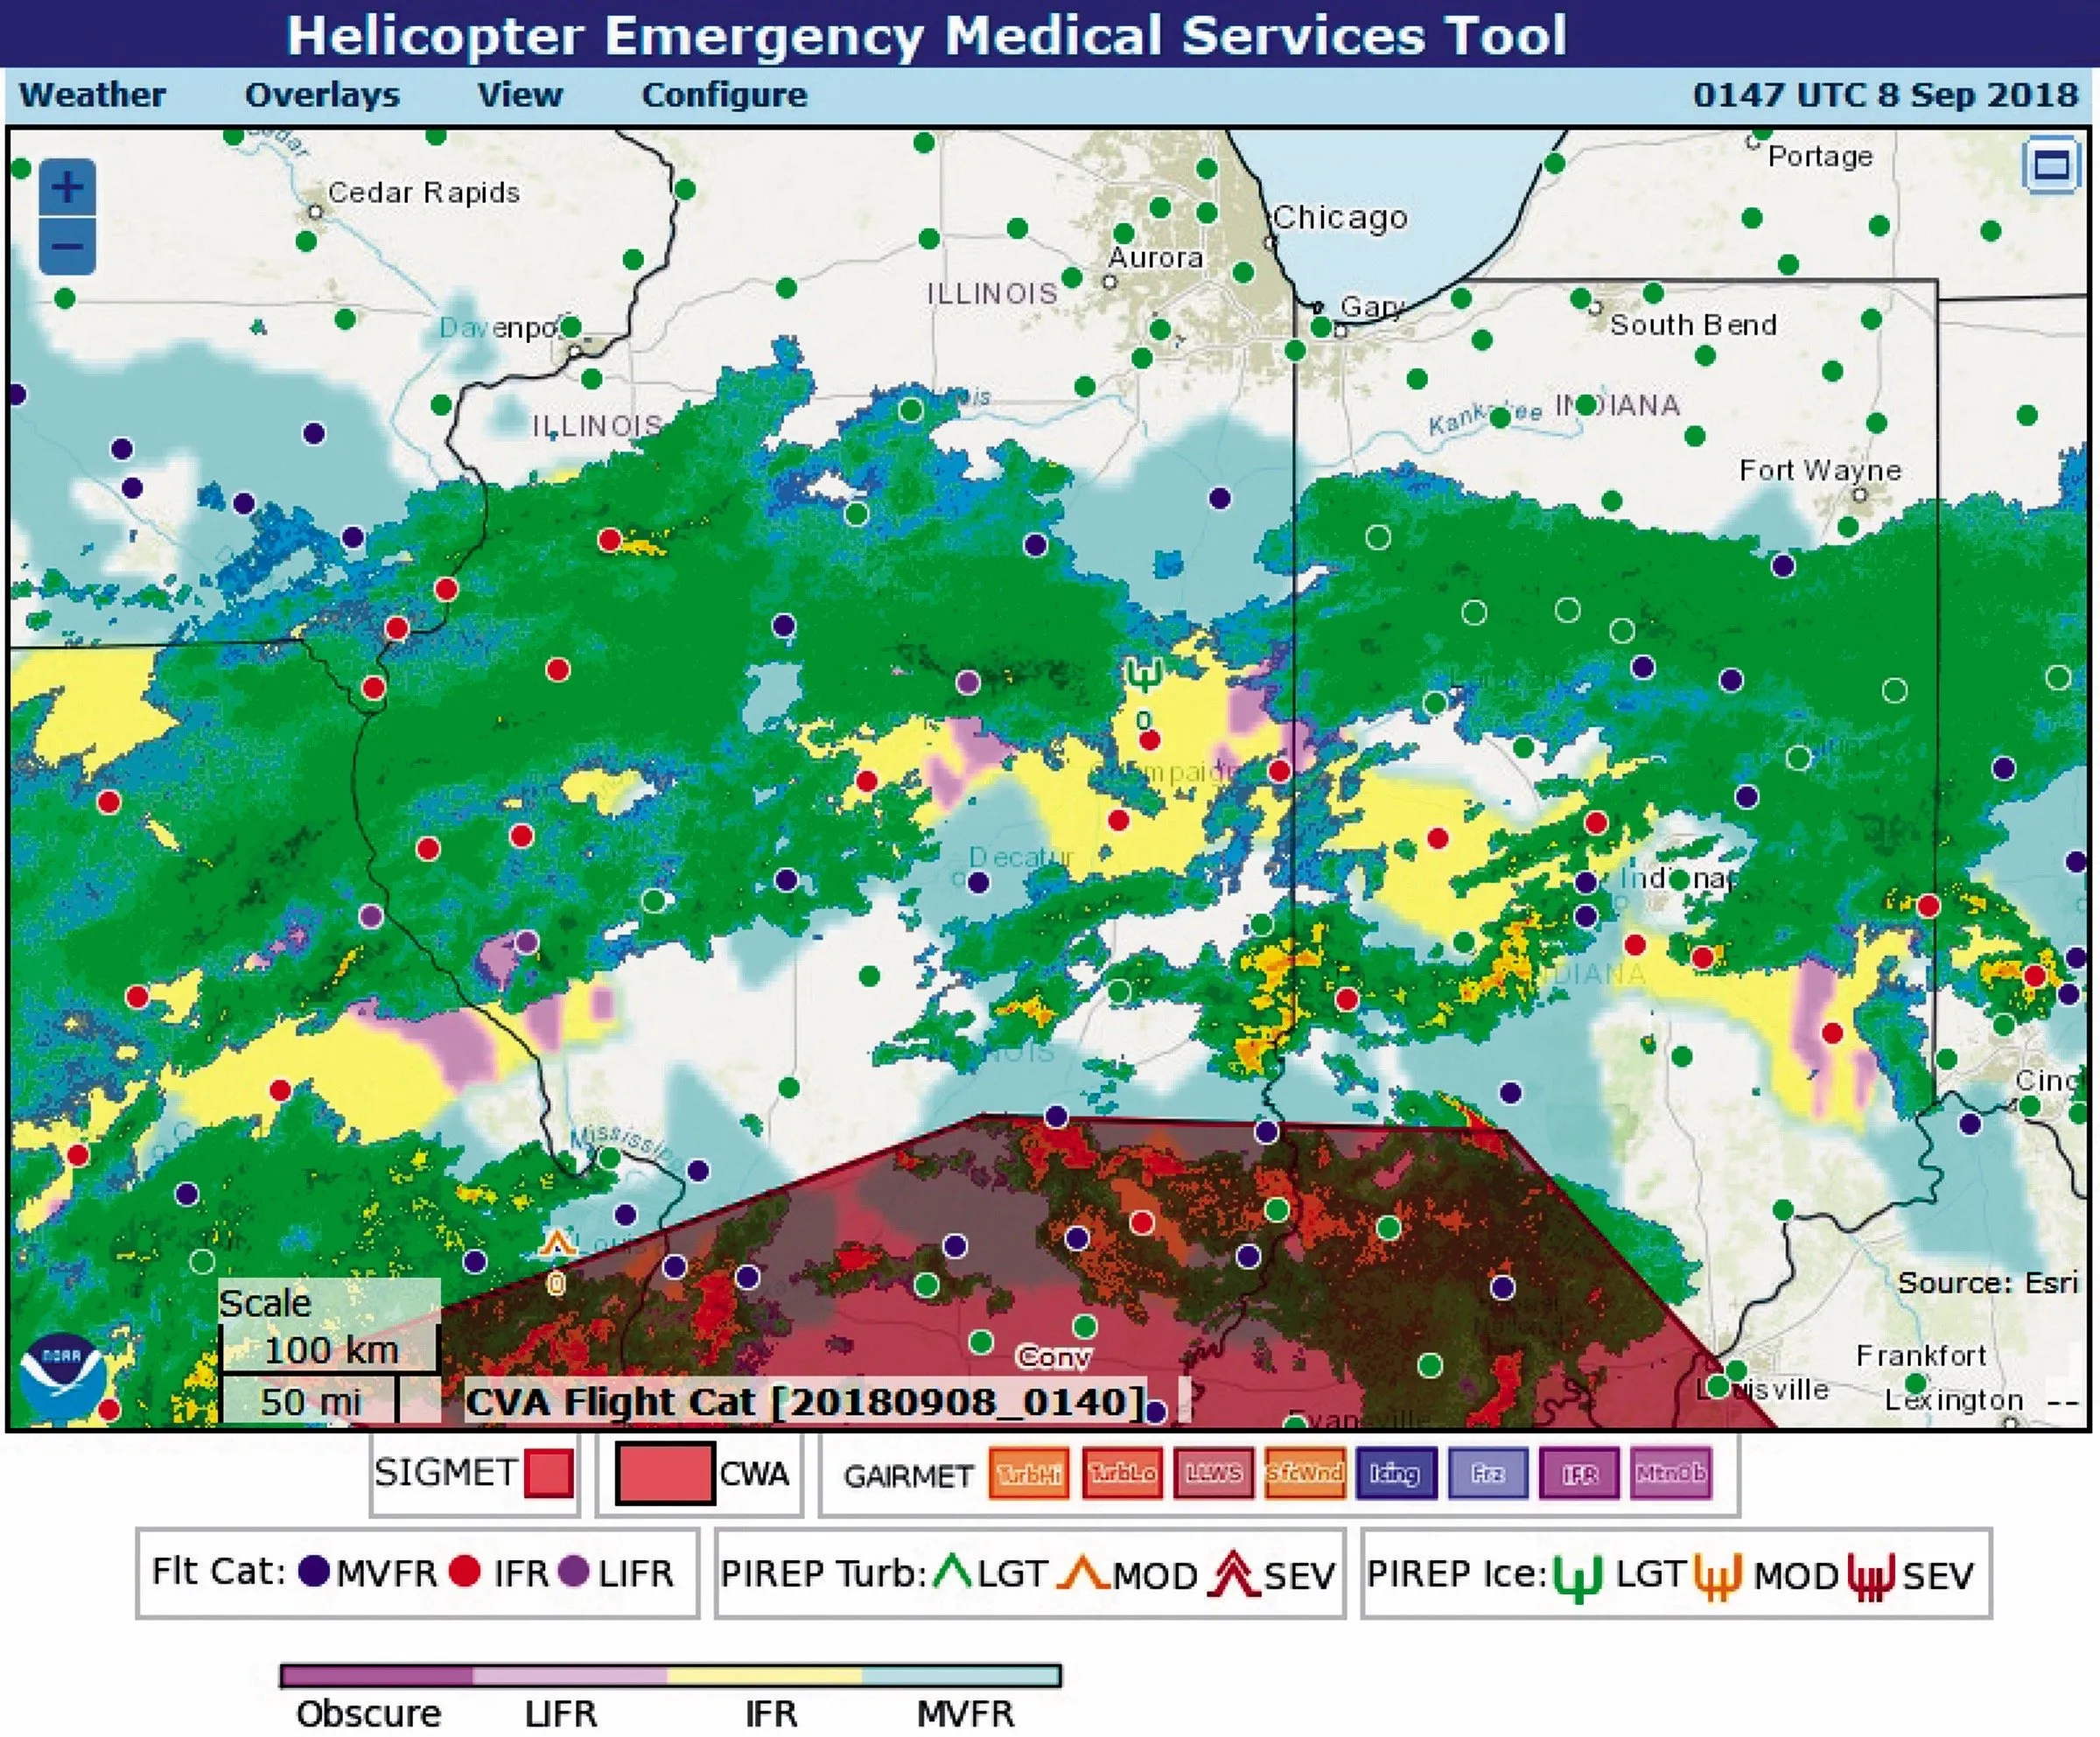
A ceiling is the lowest layer covering more than half the sky. Your best planning tool for ceilings is the TAF. Computer model products like the NOAA HRRR suite have gotten better at forecasting ceilings, but they require processing many other base fields, and the models require cross-checking by forecasters before being used operationally. Trends in the ceiling over time, however, are useful, but be careful.
Be aware of the distinction between MSL and AGL. Cloud heights associated with airports are customarily given in AGL. But areal guidance products, area forecasts, and PIREPs, use MSL. Also, anything stated as a “ceiling” or carrying the “CIG” abbreviation is AGL. Since IFR and MVFR conditions are based upon ceiling height, centralized products will always use AGL ceilings when constructing an IFR/MVFR depiction. If there is any doubt, find the information ahead of time or talk to a briefer.
Mountain Obscuration
Controlled flight into terrain is disturbingly common, and it happens even to the most highly trained pilots: American Flight 965 in Colombia, Korean Air Flight 801 in Guam, and Pakistan Flight 268 in Nepal are notable examples. This is why mountain obscuration is in a category of its own. Of course, accurate navigation is critical in the mountains.
Carefully review the topography where you’ll be flying. Check the MEAs, MEFs, and MORAs (note that MEFs don’t account for obstacle clearance), and be extra vigilant when it’s a frontal or convective weather situation. Any combination of significant moisture and instability always means the potential for low ceilings and visibility in mountainous terrain. There is no picking your way through except above the terrain.
In the December 2017 Wx Smarts, we presented a case study of an accident in Montana that was absolutely avoidable. Stations in the valleys were VFR, but the mountains were thick with towering cumulus, and a pilot elected to penetrate the clouds to remain on his route. He did not make it. In the April 2018 article we discussed a biplane in California that tried to dodge mountain obscuration by flying at treetop level. He didn’t make it either.
Turbulence
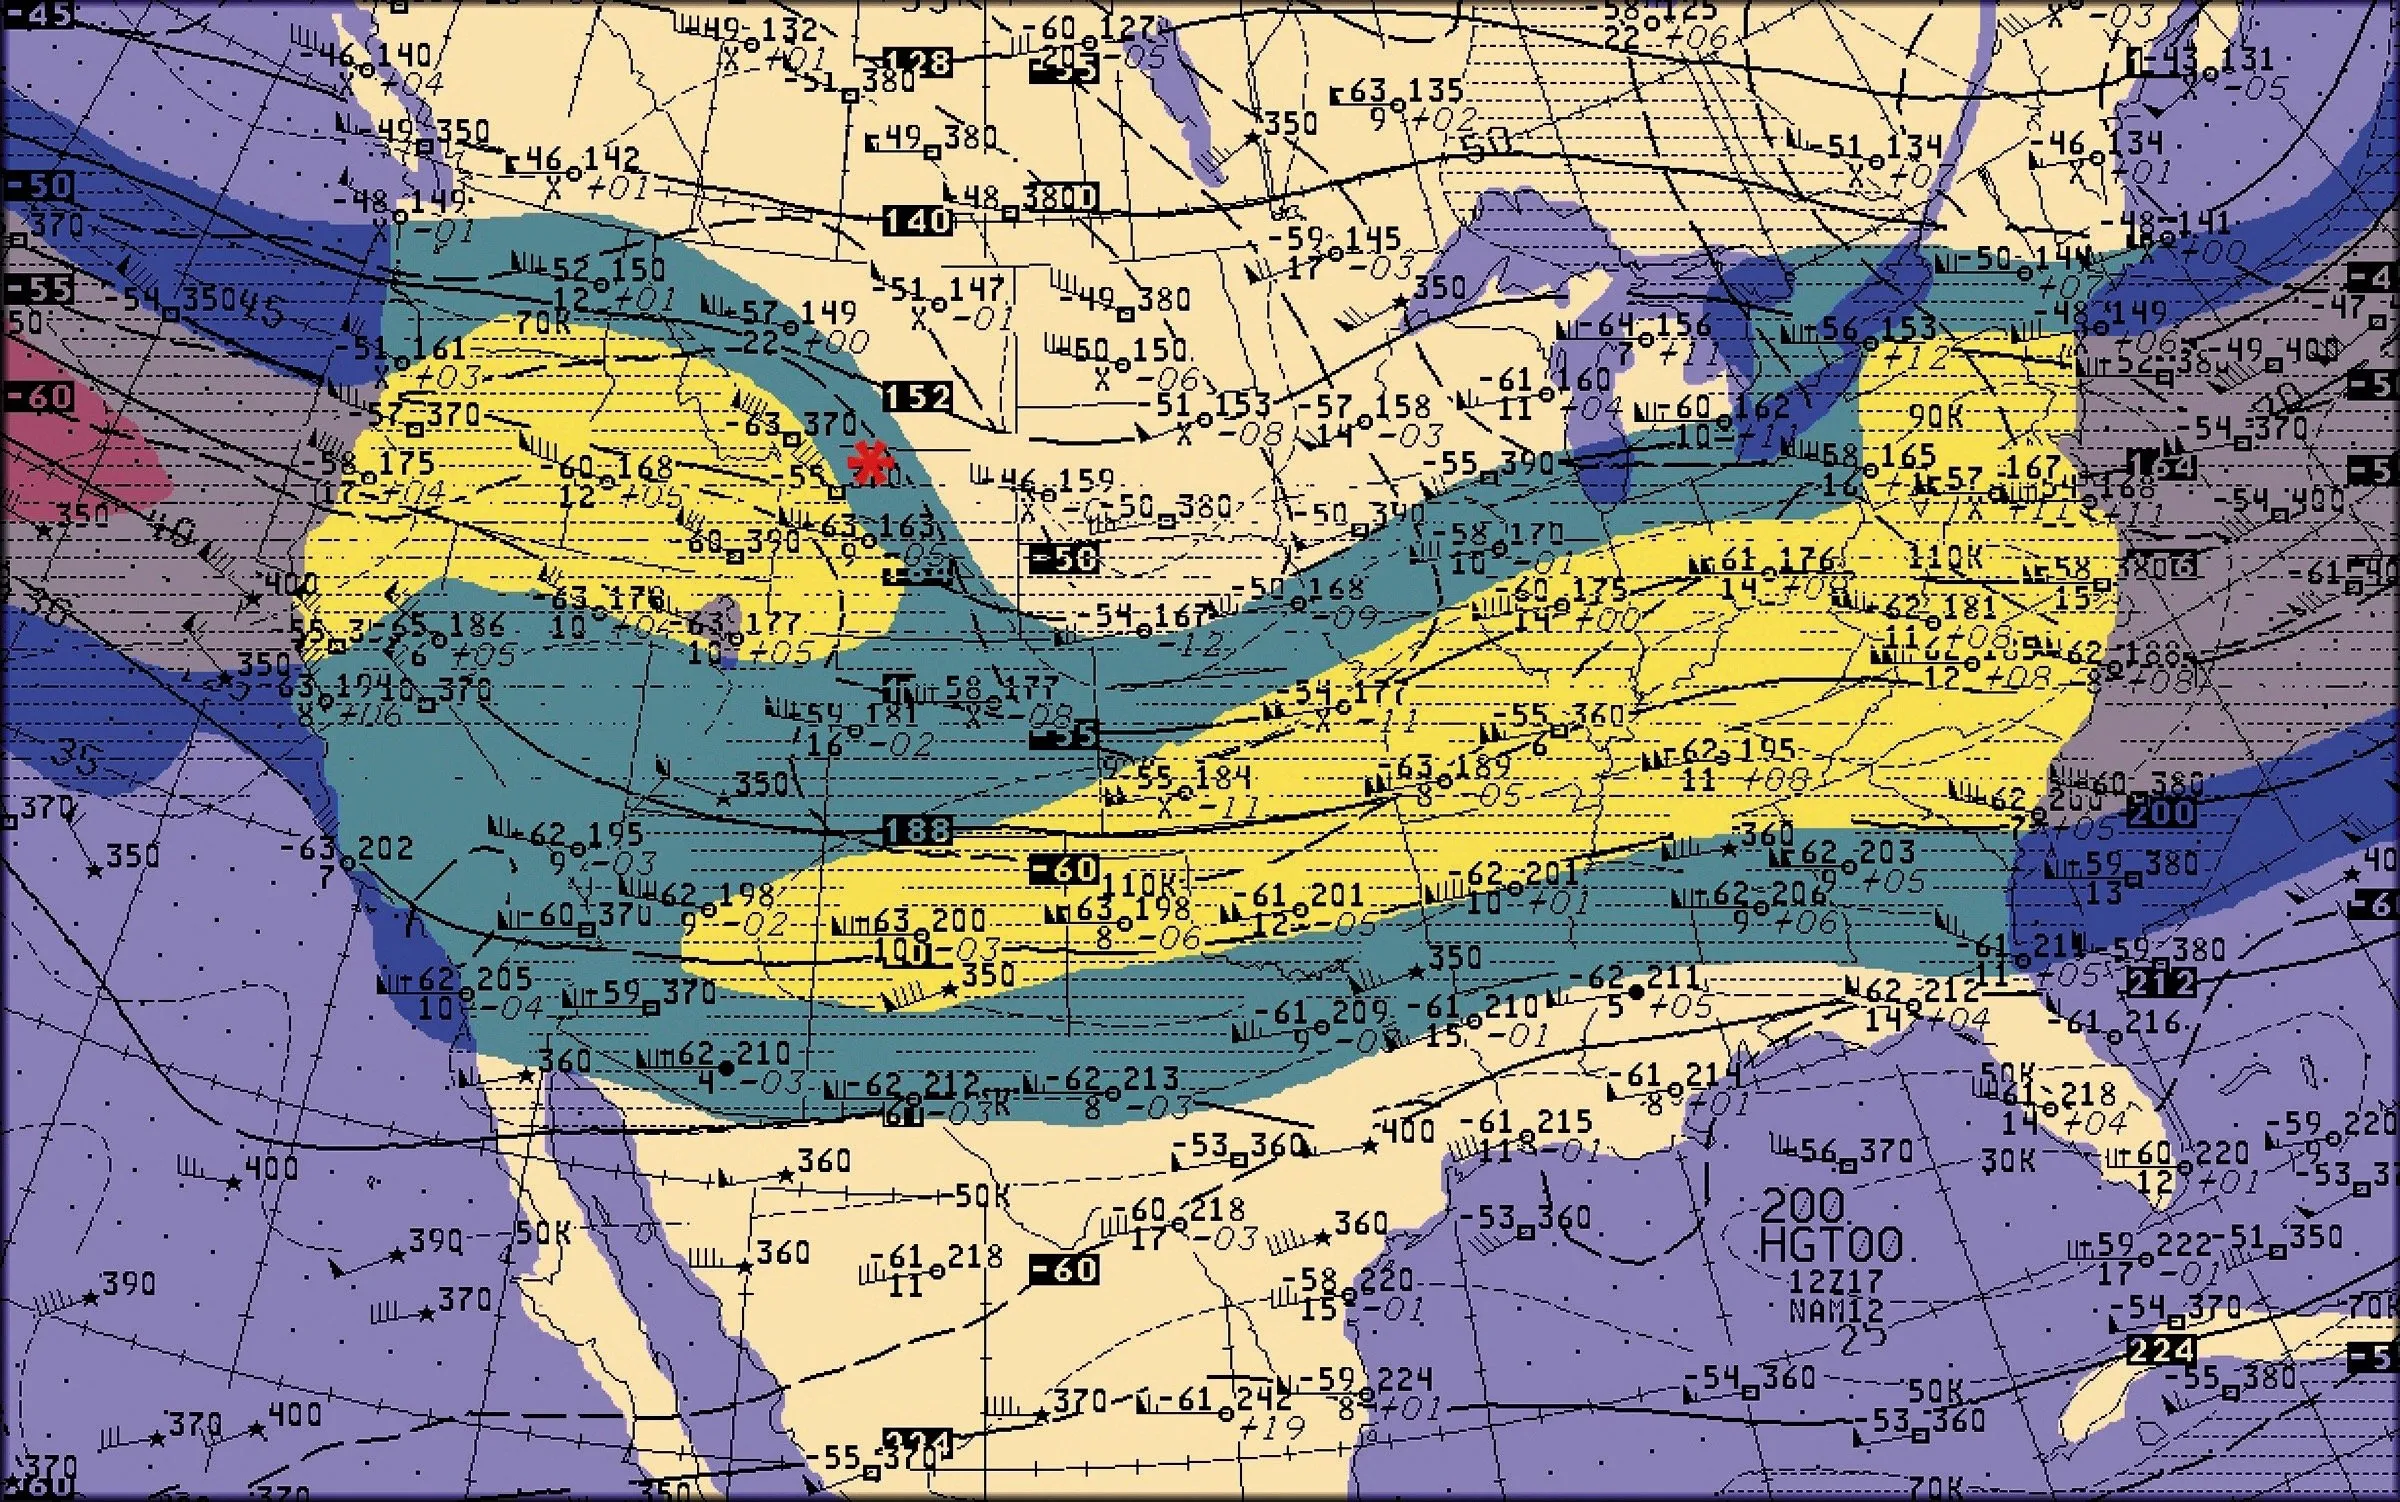
Turbulence is easily anticipated. Clear air turbulence is most common during the cool season when upper-level winds strengthen and cross large mountain ranges, especially in an environment with even weak instability. Mechanical turbulence is linked closely to strong surface-based instability (such as solar heating or cold air passing over warm terrain), strong pressure gradients, and speed shear and directional shear in the lowest mile of the atmosphere.
In mountainous regions, a rule of thumb for moderate or greater turbulence is winds over 20 knots near the tops of mountains and ridge lines, especially perpendicular to mountain ranges. If winds are less than 20 knots, flying will usually be smooth except where there is strong solar heating of the terrain.
Wind
Thankfully computer models do an excellent job forecasting wind speed and direction, but struggle with sudden changes in the wind and gusts.
Sudden changes usually come from the approach of outflow boundaries. This was a cause of the July 2018 duck boat disaster in Missouri—it wasn’t the storm itself that killed 17, but the sudden increase in winds on the leading edge. These outflow boundaries can surge outward up to 30-40 miles from a storm and produce unexpected wind shifts. Likewise, traditional fronts, troughs, drylines, and sea breezes can bring a wind shift, and these are normally accompanied by brief wind gusts as the atmosphere tries to re-establish equilibrium.
Gusts themselves are difficult for computer models to capture because they represent small-scale circulations on the order of meters. They occur when a uniform, laminar wind field becomes structurally unstable and “breaks up” like waves at the beach. In meteorology we look for combinations of thermal instability (e.g., cold air over warm air, or a cold air mass over heated terrain), vertical shear, and friction. Pilots can’t really second-guess gusts in the models and TAFs, but anything that increases the cold-over-warm profile of the surface air or strengthens the differences between the surface winds and the winds at 1000 or 2000 feet will increase your risk of gusty conditions out at the runway.
Icing
The freezing level has traditionally been used to pinpoint icing potential. During the warm season it normally ranges from 10,000 to 15,000 feet MSL, but at other times it obviously can be as low as the surface. Flying at least a few degrees below the freezing level is considered to be safe, with danger areas near and just above the freezing level—say -5 to +10 degrees C.
But, there are dangers in relying on this rule of thumb alone. In meteorology we often see complex situations with elevated warm layers (layers above freezing). For instance, if Pittsburgh is reporting -8 degrees C with light ice pellets (-PE) and a light southwest wind, the freezing level is considered to be zero, the surface. One might assume that the atmosphere will cool further with height, getting quickly out of ice danger.
However in these situations, we frequently see overrunning of warm tropical air. The temperature at Pittsburgh might rise from -8 degrees C at the surface to 2 degrees at 3000 feet, then down to freezing at 5000 feet, and to -10 at 10,000 feet. If the pilot departs, he’ll quickly find himself in severe clear ice. Those ice pellets are made up of freezing drops that have partially melted in the elevated warm layer, refreezing in the cold surface layer. Even in the warmest air at 4000 feet, ice still accumulates on the cold-soaked airframe, or carb ice becomes a concern. And things get worse above 5000 feet where the plane enters the supercooled water in -10 to 0 degrees C with the full brunt of clear icing.
How would you stay safe? Our go-to tool in meteorology is the sounding or Skew-T chart. These are diagrams of height on the Y-axis and temperature on the X-axis for a given station on a given date/time, and are readily available on the Internet from dozens of university weather departments. Reading them is a bit of a challenge, but once you understand the chart, they’re actually quite simple. See “Skew-T Log-P Diagrams” in the September, 2018 issue.
Or, the Aviation Weather website offers easy-to-read cross-sections under their Flight Path Tool that provide not only icing potential but temperatures, giving you a clear picture of safe and dangerous altitudes.
If you’re not inclined to dig into the weather charts, make sure you have a full picture of icing levels along your route of flight when you talk to the briefer. Don’t just focus on the altitudes you hope to fly. Ask which altitudes have the heaviest icing potential and which locations are of the most concern. Again, you are building a mental picture of what will be happening all around you.
Convective Weather
Avoid thunderstorms. The FAA recommends remaining 20 NM outside thunderstorms. This sound advice will keep you away from hails that can be thrown out of the anvil for miles. Airplane-eating downdrafts can also develop rapidly in anvil clouds. That study noted that the survivability of a GA accident in a thunderstorm is lower than 50/50.
Airborne radar or a good sferics device (Strikefinder, Stormscope) is essential close to the cells. As we’ve emphasized, never rely on downlink radar close to storms. As a backup, get help from ATC—their radar data is never more than 60 seconds old.
The Extras
Review the TAFs along your route. These are created by skilled meteorologists at 122 National Weather Service offices across the country, and will provide one of the best pictures of what you can expect. “Inside METARs and TAFs” (October 2015 IFR) has a full discussion on TAFs. For extra credit, pull up a TAF from a military base. These are produced by military forecasters. Comparing civilian and military forecasts gives a good idea of the consistency and certainty that is going into the forecasts.
Also look into MOS data, covered in our March 2018 and June 2018 issues. These are available for far more stations than TAFs, and they use some of the best mesoscale models like the NAM. Computer models are most accurate in weak weather patterns, and are most likely to fail in unusual and rapidly-changing weather. So if you use MOS data, it’s especially important to look at multiple MOS stations in order to find patterns, trends, and consistency. Compare this information to other data you have.
Also consult the local NWS Aviation Discussion. These products are often overlooked in a lot of pilot training, but they’re worth their weight in gold as the forecasters are highly qualified and know their area’s weather inside out. The Aviation Discussion is regional in scope, covering a portion of a state. It’s written mostly for airlines and air traffic controllers, but pilots should definitely use this product. Often these bulletins hint at upcoming changes in the TAF.
To get your discussion, go towww.weather.gov,. click on the map to select your location, in the navigation bar choose “Forecasts” then “Forecast Discussion.” Occasionally you will need to click on “previous versions” to find the Aviation Discussion, as sometimes it is superseded by a general forecast discussion update.
In Closing
We have a long way to go before weather risks become negligible. Even with decades of improvements in technology, there are still deficiencies on the weather side of the house. For example, many pilots have been in the situation of having no ASOS at a small airport. Meteorologists call this a “data hole.” Even the most sophisticated computer models can only approximate what’s happening there. And there are processes in the atmosphere we simply can’t solve with precision—cloud processes, radiation transfer, evaporation, and friction come to mind.
This means we probably won’t achieve accurate model forecasts for decades, and I am adamant that one of the best investments you can make for the next 30 or 40 years is to learn all you can about meteorology. You might never have to write a TAF, but you’ll want to know as early as possible when things aren’t going as expected and have a plan in the back of your mind.
As many NTSB reports and CVR transcripts have shown, the realization that a pilot is out of his depth usually comes swiftly and suddenly. The keys to lengthening the margin between safe flight and disaster are knowledge, experience, and situational awareness. In Wx Smarts we try to give you the knowledge, explain what to look for to improve your situational awareness, and give you the benefit of our experience. From there, it’s up to you.
Tim Vasquez forecasted icing and turbulence for everything from the C-130 to the U-2, but now he works in Texas, distilling his experience in IFR and writing weather books and software.




Hi Tim,
I started writing TAFs in 1969 and moved on to teaching meteorology at St. Cloud State in 1989. I’ve been a CFI since 2003 and CFII since 2005 and have enjoyed your columns since (???) a few years ago. The subject matter in this column is fundamental and of critical importance. Thanks for writing it. One issue I have though, is with suggesting the general public use skew-T’s (by the way, I helped with the revision of the Air Weather Service Pub on Use of the Skew-T Log P Diagram in Analysis and Forecasting while I was assigned at HQ AWS as a reservist.) for their self-briefing; the skew-t is much too complicated for the average pilot. I applaud suggesting pilots call flight service for help with weather planning.