Those words were penned by Alexander Hamilton after witnessing a hurricane first hand on St. Croix in 1772. It attempts to convey the fury possible in a hurricane.
According to the foremost experts at Colorado State University, the United States is facing a busy tropical weather season this year. The El Nino pattern is expected to shut down, allowing a large amount of accumulated cyclone energy in the Atlantic basin. Six to eight named hurricanes are expected, with three being major hurricanes.
As you pick up this issue ofIFR, hurricane season is about to start. June is when the earliest tropical cyclone action begins, and by July things are becoming active in the Caribbean and western Atlantic. The peak threat coincides closely with the sea surface temperature maximum, which occurs during the second week of September. Fortunately by late October to early November, there is a rapid decrease in hurricane activity.
Although hurricanes are easily avoidable since they usually move to the front of the national news cycle, it’s good to have a working knowledge of them. One day you may find yourself caught in outer spiral bands as you try to move your plane out of danger, or your area may be the new target of a hurricane that deviates unexpectedly. Or perhaps you simply find yourself in the Caribbean in the late summer months with erratic Internet access—possibly a fortunate situation.
What is a Tropical Cyclone?
The tropical cyclone is the catch-all name for any storm worldwide that has tropical origins and is fueled mostly by latent and sensible heat in the ocean. These storms include thehurricanewith sustained winds of 65 knots or more, thetropical stormwith 35- to 64-knot winds, thetropical depressionwith winds 20 to 34 knots, and thetropical waveoreasterly wavewith winds less than 20 knots. All these storms lie on the same spectrum. They all have a lot of overlap in dynamics and structure, and are forecast using very similar techniques. Intense tropical cyclones are named hurricanes in the western hemisphere, typhoons in the west Pacific, and cyclones elsewhere, but structurally they are all identical except for the reversed rotation in the southern hemisphere.
Most of these get their start as atmospheric disturbances that move westward through the tropical latitudes. Some of the ones that affect the United States can be traced all the way back to Ethiopia and Sudan, where clusters of thunderstorms produce heavy rains and haboobs (dust storms), but more commonly these clusters are first spotted along the west African coast, producing heavy rains in places like Senegal, Guinea, and Sierra Leone. All of these waves move from east to west, and are known aseasterly waves. (In meteorology, weather systems and winds are usually named according to where they originate.)
Once these easterly waves move westward into the Atlantic, they begin picking up water vapor, which comes from evaporation of the warm ocean waters. This water vapor is a key ingredient because to provide energy, all it needs to do is rise through the troposphere and saturate. This produces condensation, clouds, and latent heat that is locked in the molecules until they change back into water drops or ice. When there is a large mass of latent heat release in the lower part of the atmosphere, this results in much faster upward motion, heating of the column, and barometric pressure falls due to the low-density air. The pressure falls, producing a pressure gradient that causes more air to converge inward.
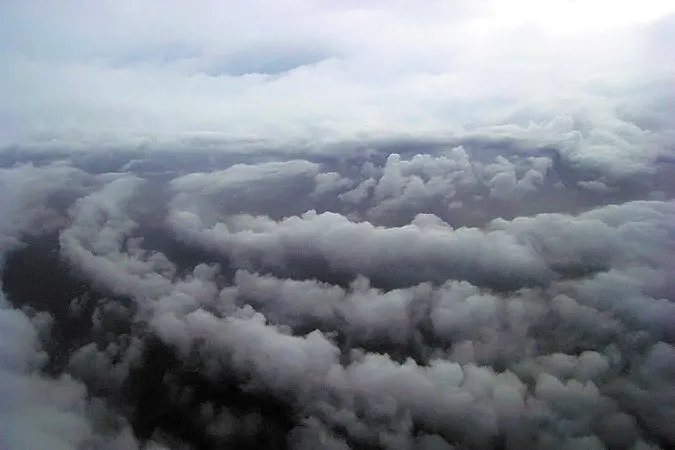
Five Key Ingredients
Though easterly waves coming off the west coast of Africa are often mentioned as a source of hurricanes, these aren’t always necessary. All we need is a pre-existing disturbance, such as a subtropical low, an intertropical convergence zone low, a thunderstorm cluster, or even a frontal low. This is how some hurricanes seem to arise spontaneously in places like the Gulf of Mexico and the Caribbean.
Coriolis force is another necessary ingredient. Without it, we only need to look at what happens to storms within about 10 degrees of the Equator, where the Coriolis force is weak. When this happens, the air moving into the storm flows directly to the center of the circulation, filling the barometric pressure loss and weakening the tropical cyclone. One of the most southerly hurricanes on record, Hurricane Ivan from 2004 only made it as far south as 10.2 degrees north, and south of that latitude the record books are almost completely devoid of hurricanes.
For our third ingredient, the sea surface temperature needs to be 26.5 degrees C (80 degrees F) or greater. This is one reason hurricanes are rare in Hawaii, where maximum temperatures are often 23 degrees C just to the east of the islands. Energy increases substantially with increasing temperature, and below 26 degrees C there’s simply not enough instability and latent heat to fuel the pressure falls needed to intensify a storm.
The large-scale vertical wind shear ahead of the storm must be weak, preferably less than 20 knots. This is why hurricanes sometimes don’t form when all other conditions are favorable, and why they’re almost non-existent in the South Atlantic Ocean. By wind shear, we mean that there is a strong vector difference between the winds in the lowest few thousand feet and the winds up in the middle troposphere. The larger the storm, the deeper the layer we must observe. If you’re curious, the University of Wisconsin attropic.ssec.wisc.edu. has some good wind shear charts.
Finally there must be an outflow mechanism aloft, such as an upper-level high or ridge. This helps ventilate the storm, much like opening a chimney to get rid of the smoke. If there’s no outflow, the mass accumulates near the center of the storm, which causes the pressures to rise and the storm to weaken. This means that, yes, you will find an upper-level high above the storm if you go to the top of the storm, but you’ll usually have to go above 40,000 feet (200 mb) to find this region. This is higher than most of the usual Internet upper-level charts go.

Signs of a Hurricane
When you’re far from the storm, perhaps out on an all-day fishing cruise or just flying over the local waters, one of the first signs of a hurricane is the arrival of long sea swells, with large distances and time periods from crest to crest. These will be coming from the region of the storm, pushed ahead of it. You may also see the sudden arrival of an extensive, high-altitude cirrus field.
As the storm gets within 500 miles, there aren’t yet clear signs of trouble on the barometer, but pilots often notice a pronounced lowering of the trade-wind inversion. The sky looks bluer, the weather is fair, and you don’t have to climb as high to reach smooth air. This is due to subsidence as air spreads away from the hurricane, just under the stratosphere, and sinks. The weather looks excellent, and it may lull you into a false sense of security.
Once you’re on the periphery of the storm, the surface winds often back counterclockwise with time, perhaps shifting from east to north. For example, say you’re at the bar in the Virgin Islands. You pick up your phone and glance at the METAR reports, and they’ve changed from the typical 05008KT to 01014KT.
Around this same time, the barometer often begins falling sharply. Cirrus clouds begin thickening into cirrostratus, and the trade-wind inversion rises, with the sky taking on a more hazy appearance. You will then see dark skies to your east or south as the outer spiral bands approach.
The first outer spiral bands arrive, usually as a line of strong storms. Winds are only 15 to 25 knots, but these storms may produce damaging tornadoes and waterspouts. In between the spiral bands is an area of overcast cirrus and altostratus, with showery precipitation alternating with cloudy skies, and ceilings averaging 1000 to 3000 feet. Winds average 20 to 40 knots, with higher gusts.
The inner spiral bands comprise the bulk of the storm. These spiral bands bring heavy, continuous rains, which almost completely encircle the storm. Ceilings drop down to less than 1000 feet in light rain, occasionally alternating with near-zero visibility in torrential rains. Weak, brief, fast-moving tornadoes are likely in this region, especially where a hurricane is making landfall. They’re most likely in the forward right quadrant of the storm near the most intense cells.
Finally we encounter the eyewall of the storm. This is a part of the inner spiral bands that forms a ring around the eye, often with high rainfall intensities. Winds are at their maximum here. Tornadoes are not common in this area, but the high winds and friction with landmasses make brief “gustnado” vortices possible.
In strong storms, there will be an eye. Winds drop dramatically here, and there are broken to scattered stratocumulus layers, most of them at 1000 to 3000 feet. Aloft, temperatures are unusually high in the eye and may approach 20 degrees C higher than normal. Hurricane Hunter aircraft in Pacific typhoons have reported air temperatures of close to 32 degrees C (90 degrees F) at 10,000 feet in these eyes!
On the back side of the storm, there is the reverse of the entire sequence. In some storms, particularly those approaching the US coast, a dry slot may arrive on the south side and wrap around to the east side, clearing the weather out quickly as the inner spiral bands pass. Outer spiral bands are less of a hazard behind the storm.
Forecasting the Track
One of the most difficult forecast problems faced by meteorologists is anticipating the movement of tropical cyclones. A number of rules of thumb were developed in the 1950s and 1960s, but these were based almost entirely on extrapolation or on models of frontal lows. None of these work well for hurricanes. Only in the 1970s and 1980s with the development of statistical and specialized dynamic models have we come close to having reasonable hurricane forecasts.
The most accurate tropical cyclone models we have are those built into the GFS (US) and the ECMWF (Europe) models. Other useful models are the GFDL (US), UKMET (UK), HWRF (US), and NOGAPS (US Navy). These are the important ones that should be heeded. Other specialized models are dynamical ones like the BAMM and LBAR, and statistical ones like SHIPS. To view all of these products, a popular site is Tropical Atlantic,tropicalatlantic.com/models.
One “model” you might see is the OFCL. This is actually the official, human forecast from NHC, which can also be obtained atwww.nhc.noaa.gov/. The NHC track is frequently displayed on model sites to help you compare the output. It’s surprisingly accurate since it represents the best of both human and machine forecasts, but understandably it will be slow to reflect late-breaking changes due to NHC’s desire to ensure consistency before making major adjustments to the forecast.
You can keep tabs on hurricane tracks using satellite imagery. There are very few websites that will easily allow you to obtain your own precise latitude and longitude fixes, but if you’re sitting in an FBO with a laptop and nothing better to do, get McIDASwww.ssec.wisc.edu/mcidas. It is a free and sophisticated tool that will let you roll your own satellite images just like the professionals and get precise locations where the eye is located. When the hurricane comes within 100 miles of the coast, you can then turn to radar to get a better position; tools like GRLevelXwww.grlevelx.com. and Digital Atmospherewww.weathergraphics.com/da. and the free NWS radar pageradar.weather.gov. all allow you to get lat-long from radar images and get exact info that the cable channels don’t show.
Though you can track the hurricanes yourself, you do need to be aware of the phenomena of “wobbling”, known by forecasters as trochoidal motion. This happens when there are smaller-scale circulations embedded in the eye, producing rotation of the eye that is off balance—like an overloaded clothes dryer—creating a cyclonic “wobble” in the plotted track. A series of plots of the eye location over the course of a day, however, often reveals when this is happening.
For intensification and weakening, we rely mainly on dropsonde measurements and infrared satellite imagery. The existence of lightning in the inner spiral bands, as observed on your strikefinder or on lightning maps, is a good indication that the storm is intensifying. Also the areal growth of cold tops in the inner spiral bands, as observed on infrared satellite imagery, is one of the best signs of intensification. This is the backbone of the Dvorak Technique used by meteorologists. You can view automated Dvorak analyses attropic.ssec.wisc.edu/misc/adt. and see graphs of hour-by-hour intensity trends.
Dealing with Tropical Cyclones
Obviously the best advice about hurricanes, tropical cyclones, and tropical storms is to keep your distance and move your plane away as early as possible. Even with the great advances in mesoscale meteorology and modelling over the past 20 years, hurricanes are still extremely challenging to forecast and are not as predictable as midlatitude frontal systems.
But keep in mind there are a wide range of tools at your disposal for getting more information than the news channels are telling you. We’ve outlined a few ideas here, but this also includes local weather service forecast discussions, the NHC discussion product, blogs such as Jeff Masterswww.wunderground.com/cat6,. and even discussion forums. There’s no shortage of information these days; the only real question is what decisions you make with it. Be safe.
Tim Vasquez is a meteorologist in Texas who writes books and articles, programs, and tries to make it big as a weatherman on YouTube. See his website atweathergraphics.com.
